Our Comprehensive Excel Consulting Services

Custom Features for Different Needs
This service creates custom Excel spreadsheets for specific business needs. For example, an inventory management system could track stock levels automatically, alert when it’s time to reorder, and store supplier details. A financial model might include cash flow forecasts, compare budgets to actual spending, and allow for different scenario testing.
The goal is to make easy-to-use, efficient tools that simplify complicated tasks. These spreadsheets are designed to be user-friendly and easy to understand.

Using Excel's Advanced Tools
Making Charts and Graphs
Excel has many useful tools that can help turn numbers into useful information. One of these tools is pivot tables, which can take big sets of data and sum them up quickly. This makes it easier to spot trends in different parts of the data. You can also use charts and graphs to show how data changes over time or to compare different groups.
Cleaning Data with Power Query
Another helpful tool in Excel is Power Query. This can be used to tidy up and change data from different places, getting it ready to be looked at more closely. The main aim of using these Excel tools is to help clients find patterns and trends in their data. Sometimes these patterns aren’t easy to see when you’re just looking at the raw numbers.
Finding Patterns in Data
By using these Excel features, we can help clients spot chances to improve their business that they might have missed before. It’s all about making the data easier to understand and use.

VBA Development and Automation
VBA: Excel’s Automation Tool
Excel’s Visual Basic for Applications (VBA) is a useful tool for automating tasks in spreadsheets. Developers can make custom macros to speed up jobs like creating weekly reports, doing complex math across many worksheets, or bringing together data from different places. These automated tools save time and help avoid mistakes that people might make, making Excel work better overall.
Excel Apps: Advanced Macro Workbooks
Excel apps are a step up from macro workbooks. They’re well-made and can sometimes replace other software, giving users custom solutions for their specific needs. These apps fill the space between ready-made software and custom-built programs, meeting particular business needs in a flexible way.
Benefits of Excel Automation
Using these advanced Excel tools can really help organizations. They free up a lot of time that would be spent on routine tasks, letting employees work on more important things that need thinking and creativity. Also, because there’s less manual data entry and calculation, there are fewer mistakes, which means the results are more trustworthy. This can lead to big improvements in how much work gets done, better choices being made, and people’s time being used more wisely.

Financial Modeling and Forecasting
What are financial modeling and forecasting?
Financial modeling and forecasting are key tools that help businesses plan ahead and make good choices. These methods use math to show how a company’s finances work, letting managers look at different situations and guess what might happen.
Our Excel-based financial modeling services
Our Excel experts are great at making complex financial models. These models include important things like expected income, costs, and market changes. We team up with our clients to really get how their business works, and then we make models just for them. These models give accurate predictions and useful information. Our Excel financial modeling can help all kinds of businesses, from new startups trying to get money to big companies wanting to improve their financial plans.
Training and support for financial modeling
We don’t just make financial models – we also teach people how to use them. Our experts can show your team how to do financial modeling in Excel. We teach them the best ways to look at data, plan for different situations, and check how small changes might affect the bigger picture.

Dashboard Creation
Data Visualization with Dashboards
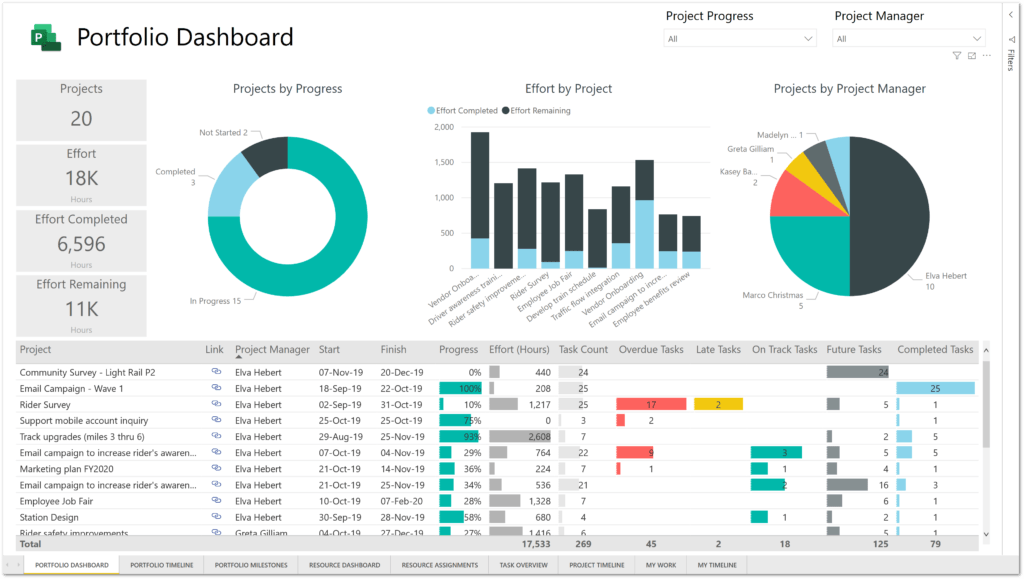
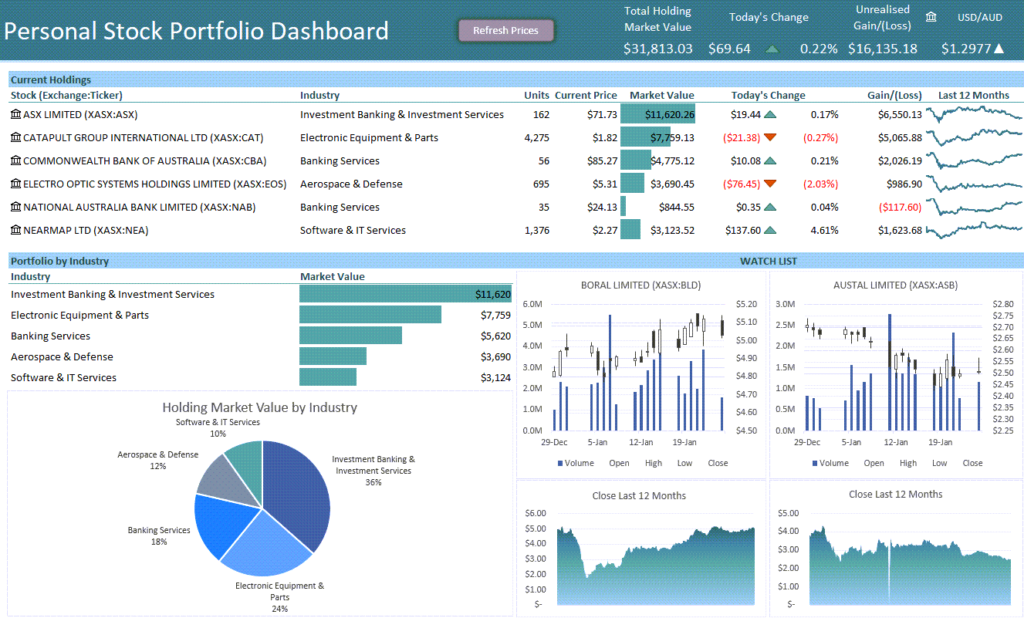
Excel dashboards are great for showing complex data in a simple way. They help companies keep track of how well they’re doing, see if they’re meeting their goals, and spot patterns quickly. We can make custom dashboards that turn raw numbers into clear, useful information. This helps businesses make better choices based on real data.
Custom Dashboard Creation
We know that every company is different and has its own goals. That’s why we work together with our clients to figure out which numbers and measurements matter most for their industry and what they want to achieve. Whether you need a quick overview of how your whole company is doing or a detailed look at specific parts of your business, we can make dashboards that fit exactly what you need.
Easy-to-Use Excel Dashboards
One of the best things about our Excel dashboards is that they’re easy to use and can be changed as needed. We design them so your team can update them without much trouble, which means you’ll always have the latest information. We often add features like filters and dropdown menus to our dashboards. These let users look at the data in different ways and get more detailed information when they need it.

Spreadsheet Audit and Optimization
Spreadsheet Review and Improvement
Spreadsheet Audit and Optimization is an important service for companies that want to improve how they work and make sure their data is correct. We will carefully look at your spreadsheets and VBA code to find possible mistakes, things that don’t match up, and ways to make them better. We check formulas, how data is set up, and how the spreadsheet is built to make sure your financial models, reporting tools, and data analysis systems work well and are reliable. By doing a thorough check, we can find hidden problems that might be affecting how you make decisions and give you useful advice on how to make your spreadsheet work smoother.
Making Spreadsheets Better and Easier to Use
After we finish checking everything, our experts work hard to make your spreadsheets work as well as possible. This means fixing complicated formulas, setting up data in the best way, and using advanced Excel features to do repetitive tasks automatically. We also try to make spreadsheets easier to use by improving how they look, adding ways to check if data is entered correctly, and creating designs that make it simpler for your team to put in, look at, and understand data. Our work to improve spreadsheets not only makes them work better but also reduces the chance of mistakes and saves time for your employees.

Data Integration and ETL Solutions
Data Integration into Excel
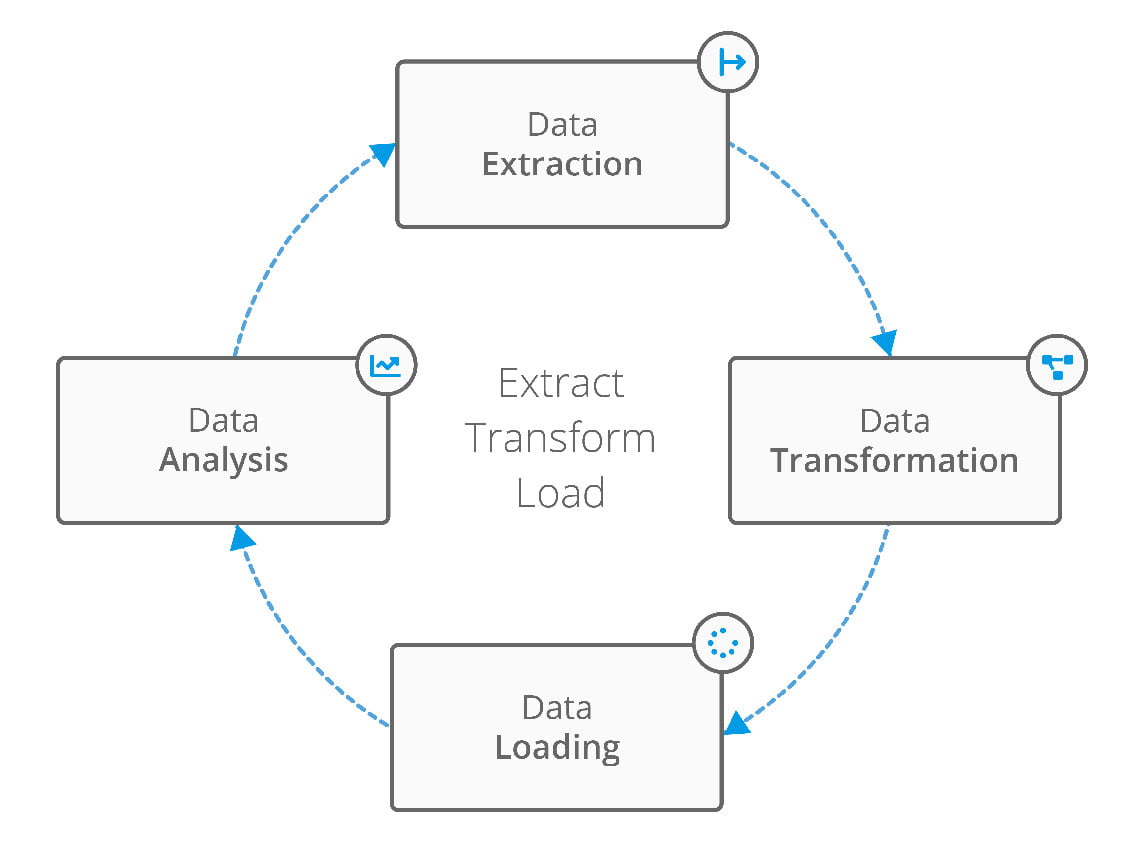
Our data integration services help you bring together information from different places into Excel. We’re good at making processes that pull data from various systems, databases, and file types, and then put it all in one place. We know that companies these days have to deal with lots of data from many sources, so we’ve created ways to simplify this and get it all into Excel.
Data Cleaning and Validation
We don’t just copy and paste the data. We also clean it up and make sure it’s correct. This means we look for mistakes, get rid of duplicate entries, make sure everything is in the same format, and fill in any missing information. We do this carefully to make sure the data in your Excel sheets is accurate and useful for your business.
Custom Solutions for Business Needs
We work closely with you to understand exactly what you need. Every company is different, so we make sure our process fits your specific situation and industry. Our solutions work for both small and large projects. We also take data security seriously and have strong measures in place to protect your information.
Scalable and Secure Data Handling
By using our Excel data integration services, you’ll be able to make better decisions based on solid information. It can also help your business run more smoothly and make it easier to create reports, all using Excel, which most people already know how to use.
